The Cape Town Plumber Who Learned to Read His Own Dashboard
By the InvoiceFlow team — published 26 May 2026 — 10 minute read
Sipho Dlamini didn't open the dashboard tab in his invoicing app for the first eight months of using it. He told us this with the slightly sheepish smile of a man who knows he should have. He was a plumber. He fixed pipes. The numbers were what they were. He had no particular reason to think a dashboard would tell him anything useful.
Then his wife — a retail manager who reads dashboards for a living — sat down with him one Saturday afternoon, opened his app, and spent an hour walking him through it. By Sunday evening, Sipho had decided to raise his call-out fee, drop one of his regular suppliers, and stop taking jobs on the Atlantic Seaboard. The data told him things he couldn't have figured out by feel.
This is what she showed him.
The metrics most tradespeople ignore
A trades business looks profitable as long as more money comes in than goes out. Most owners optimize at this level — keep gross revenue up, keep major expenses controlled. This is enough to stay afloat. It is not enough to make actual decisions.
The metrics that matter for a small trades business — and that most tradespeople never look at — are:
- Per-job net profit. Not gross revenue. The actual margin after materials, fuel, and labor time.
- Per-customer-type margin. The same job for a residential customer in one suburb may have very different profitability than the same job in another, because of travel time, customer payment behavior, and likely repeat work.
- Days-to-paid. How long the average invoice takes to be paid (covered in our Manchester plumber story).
- Material cost trend. Are your supplier costs creeping up faster than your rates?
- Repeat-customer percentage. What share of your work comes from existing customers vs new ones?
- Hourly equivalent. Total revenue divided by total hours worked — including travel and admin.
Sipho had been operating on gut feel for all of these. Looking at the data revealed the gut feel was wrong on at least three.
The Atlantic Seaboard surprise
Sipho's most "prestigious" jobs were in the affluent Atlantic Seaboard suburbs — Camps Bay, Clifton, Bantry Bay. The houses were beautiful, the rates were high, and he liked the work.
The dashboard told a different story:
- Atlantic Seaboard average travel time per job: 52 minutes round trip.
- Bo-Kaap / City Bowl average travel time: 18 minutes round trip.
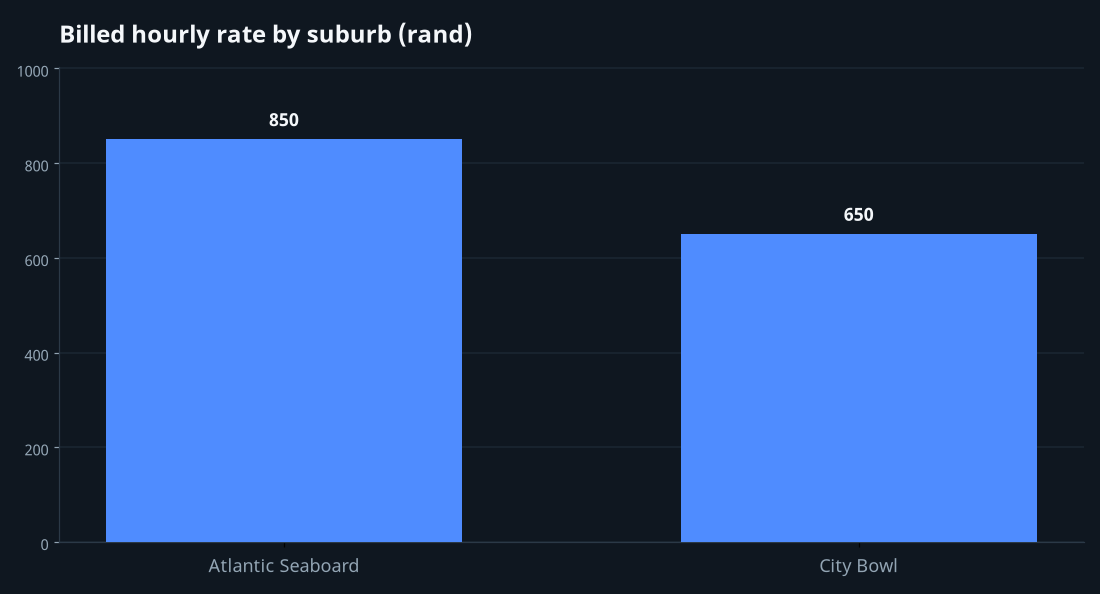
- Atlantic Seaboard rate: R 850/hour billed.
- City Bowl rate: R 650/hour billed.
On paper, the Atlantic Seaboard rate was R 200/hour higher. In effective terms — billable hours per actual hour worked, including travel — the City Bowl was meaningfully more profitable. He had been doing the seaside work partly out of pride; he was effectively paying for the view.
He didn't stop Atlantic Seaboard work entirely. He raised the call-out fee specifically for that region (R 350 instead of R 200), which compensated for the travel time and gave clients who really wanted him a clear price signal.
The supplier creep
The material cost trend chart showed something he hadn't noticed: his primary copper supplier had quietly raised prices 18% over eight months. The increases came in small chunks — never more than 4% at once — so each individual purchase felt normal. The cumulative trend was severe.
His wife's framing: "Each purchase looked fine. The aggregate is a different story."
He moved 70% of his copper purchases to a wholesaler in Maitland that he'd previously considered too far away for regular use. The actual savings over the next two months — visible on his dashboard — was R 2,400. Annualized, R 14,400 he'd been giving away.
The repeat-customer ratio
72% of Sipho's revenue came from repeat customers. He had assumed it was closer to 40-50%. This was, on the face of it, good news — repeat customers are cheaper to acquire and generally easier to work with.
But the implication mattered. If 72% of his business was repeat work, then most of his marketing time and money was being spent acquiring customers who were a small minority of his revenue. Specifically, he had been spending R 800/month on Facebook ads targeting new residential customers. The dashboard let him trace which of those leads had converted to actual revenue.
The answer was: very few, and those who had were lower-margin than his existing base.
He stopped the Facebook ads. The R 9,600/year saved went into a referral bonus program for existing customers — R 200 off the customer's next service if they referred someone who became a customer. The results, six months in, suggest this is producing 3x more genuinely profitable new business than the ads ever did.
The customer-type margin map
By tagging customers as residential, commercial, or property-management, Sipho could see margin by type:
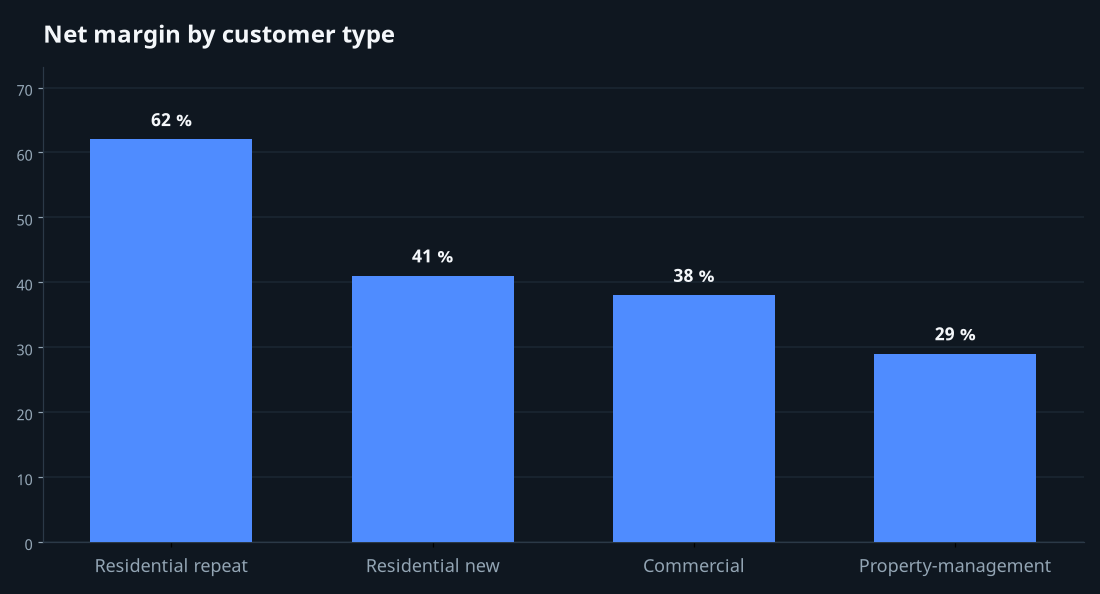
- Residential repeat: 62% margin. Excellent.
- Residential new: 41% margin. Decent.
- Commercial: 38% margin. Lower than expected.
- Property-management: 29% margin. Disappointing.
Property management work — fixing leaking pipes in rental units on behalf of property managers — had felt steady and useful. The dashboard revealed it was his least profitable category by a wide margin. The reasons were specific: property managers negotiated harder, paid slower (44 days average vs 6 days for residential), and often delayed approvals on materials, which meant Sipho ate the cost of return trips.
He didn't fire his property-management clients. He did raise his rates with them by 18% over the following six months, on the basis that he had been undercharging for the additional friction. Two of them accepted. One left. Two grew the relationship because Sipho had become noticeably more responsive to the clients who paid him fairly.
The dashboard habits that actually work
Most tradespeople don't look at dashboards because dashboards are usually overwhelming. The fix isn't more data — it's three specific habits.
1. Monthly review, 30 minutes
Once a month, look at five metrics in order: revenue, days-to-paid, per-customer-type margin, material cost trend, repeat-customer ratio. Note anything that surprises you. That's it. The point is patterns, not perfection.
2. Quarterly deeper dive, 90 minutes
Once a quarter, look harder. Per-suburb profitability. Per-service-type profitability. Hour-equivalent rate. Any specific customer who's becoming unprofitable. The quarterly review is when bigger decisions get made.
3. Tag everything at invoice time
The dashboard is only useful if your invoices are tagged with customer type, location, and service category. Tag them as you create the invoice, not later. Future-you will thank present-you.
What good looks like
A trades business owner with working analytics habits:
- Knows their average days-to-paid by customer type.
- Can name their three most profitable and three least profitable customer segments.
- Notices supplier price creep within a quarter, not a year.
- Adjusts pricing for different geographies based on actual margin, not assumption.
- Spends marketing money where it actually returns.
A trades business owner without:
- Optimizes for gross revenue and feels mildly anxious about margins they can't quite see.
- Treats all customers as roughly equivalent.
- Discovers supplier price increases when checking against last year's invoices.
- Charges the same hourly rate regardless of where the job is.
- Spends on marketing because everyone says you should.
The difference between the two is one Saturday afternoon and the willingness to look.
Sipho's last word
"My wife was right. I knew she was going to be right. I just didn't want to sit down with the numbers because I thought they'd tell me I should be doing things differently. They did. And now I am. And I'm making more money for less work."
The dashboard is not optional. It's just one of those things tradespeople tell themselves is optional, until they look.