 EN
EN  العربية
  Български
  Čeština
  Dansk
Dansk  Deutsch
  Ελληνικά
  Español
  Suomi
Suomi  Français
  עברית
עברית  हिन्दी
  Bahasa Indonesia
  Italiano
  日本語
日本語  한국어
한국어  Bahasa Melayu
  Nederlands
  Norsk
Norsk  Polski
  Português
  Română
  Русский
  Svenska
  Kiswahili
  ไทย
ไทย  Türkçe
  Українська
  Tiếng Việt
  中文
中文 User guide
Analytics, dashboard cards and reports
Read the dashboard money cards, pick a period in Analytics to see revenue, collection rate and top clients, and use Reports for a plain six-month view.
Invoice Flow keeps three different views of the same invoice data, and each answers a different question. The Dashboard tells you what needs attention today: how much is unpaid, how much of that is late, and what came in this month. Analytics looks back over a period you choose and explains where the money came from, who your best clients are and how long they take to pay. Reports is the plain version for the last six months, with no filters and no export. None of them need an internet connection; every number is computed on the phone from the invoices, payments and expenses you already recorded.
This guide follows Priya Raman, a freelance UX designer in Portland, Oregon. She bills four US clients in US dollars and two European studios in euros, and she has a year of invoices behind her, so every chart on her screens has something to show.
What you see on the screen
The Dashboard is the first tab of the bottom navigation. Its title is the name of your default business profile. In the top-right corner there are two icons: a calendar (Filter by date) and a grid with a plus (Dashboard widgets). Below them sit the stat cards, two per row on a phone, followed by whatever other cards you have enabled. An extended New Invoice button floats at the bottom.
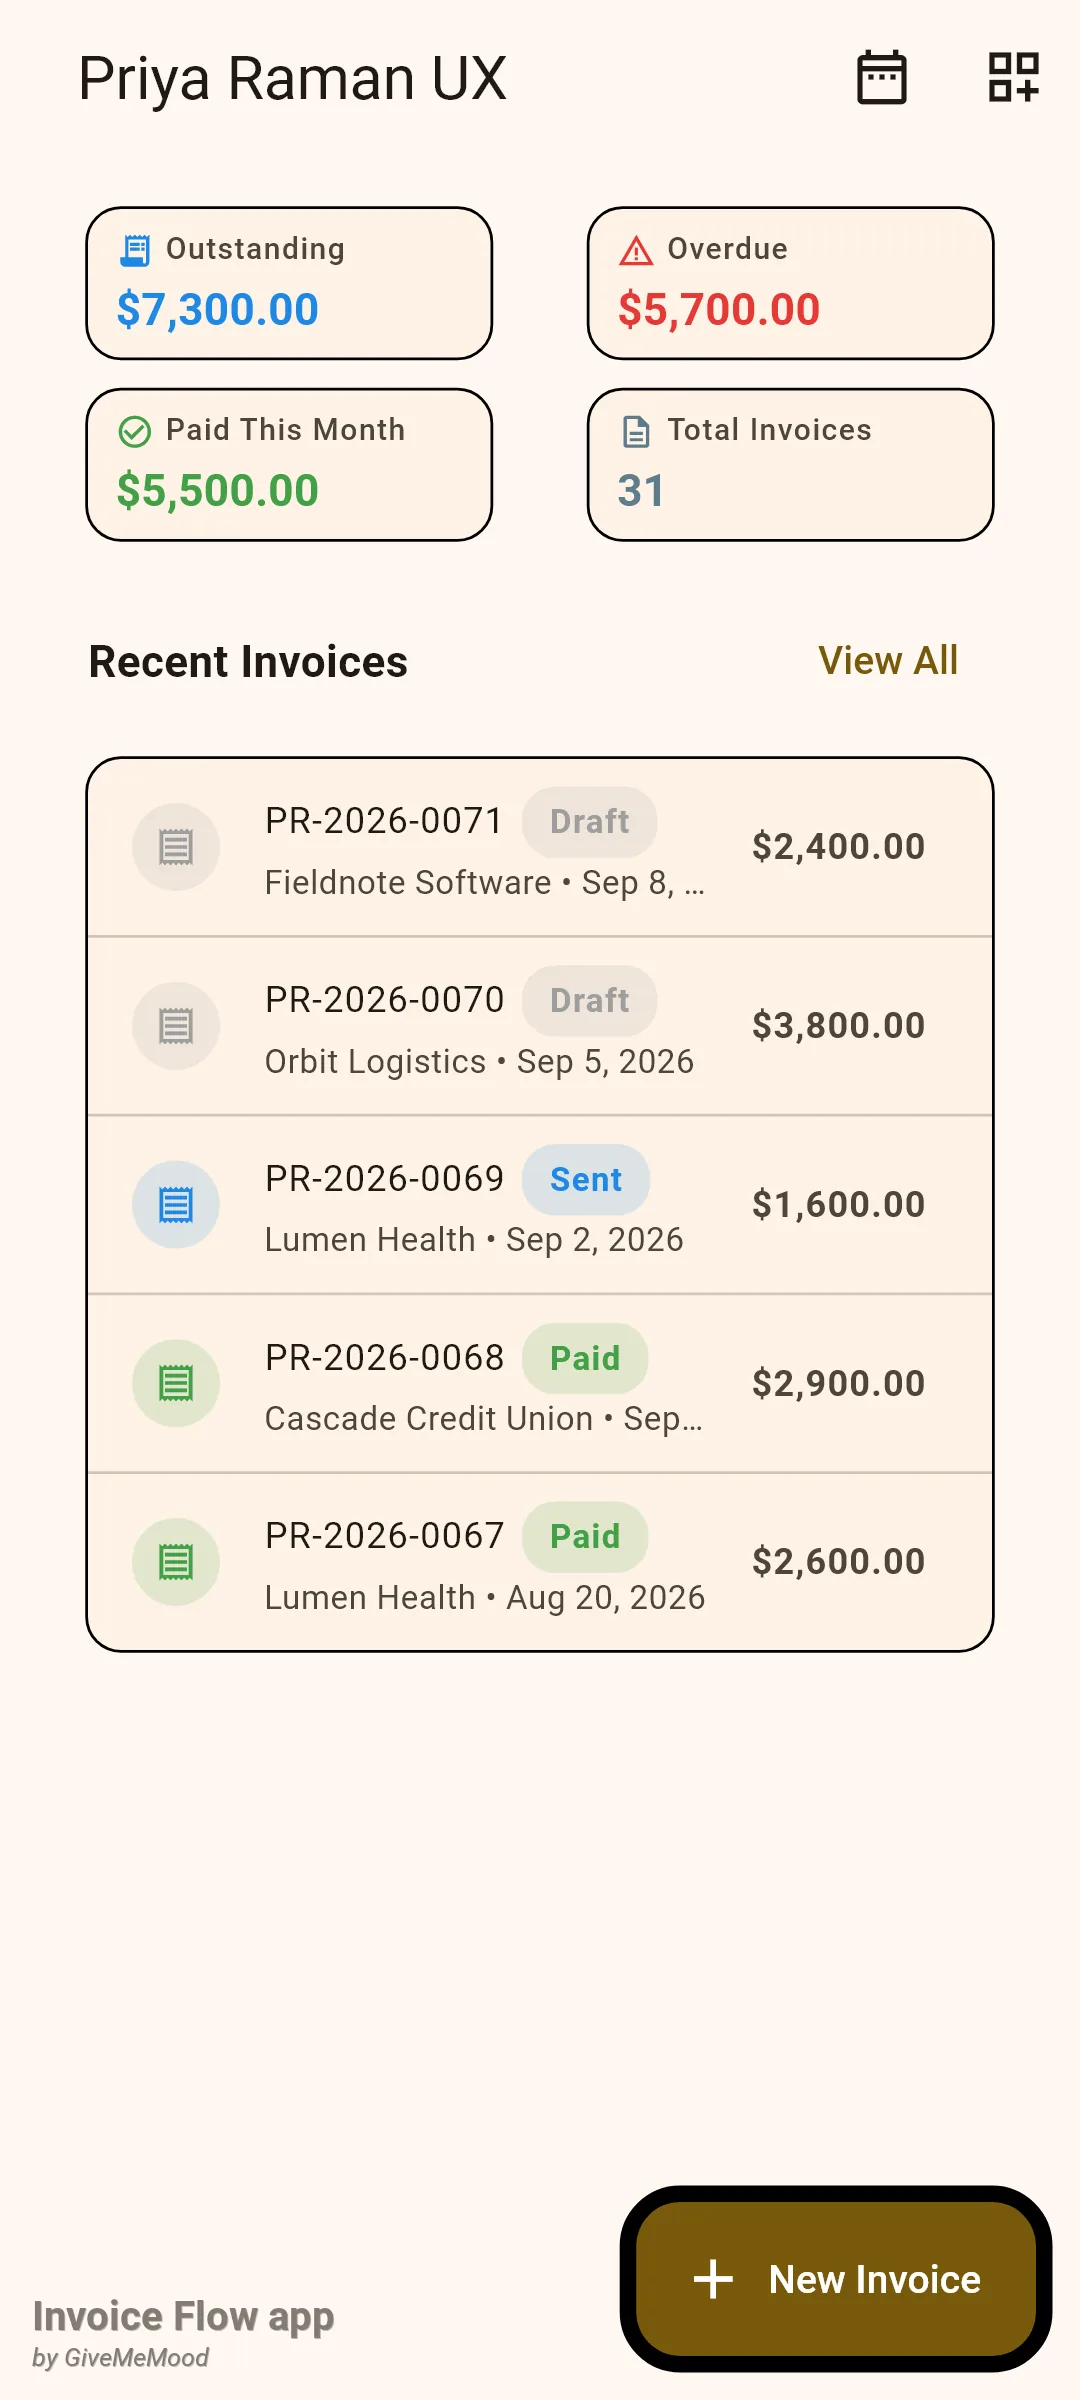
Out of the box the dashboard shows five widgets: Outstanding, Overdue, Paid This Month, Total Invoices and Recent Invoices. The Recent Invoices card lists the five newest invoices with a status badge, the client, the issue date and the total in the invoice’s own currency; View All jumps to the invoice list.
Analytics lives under the Tools tab, in the Business Intelligence section, as the green Analytics card. The screen opens with a row of period chips (This month is selected by default) and a long scrolling column of cards: Revenue Summary, Profit & Loss, Revenue Trend (12 mo.), Top 5 Clients, Expense Breakdown, Invoice Status, Outstanding by age, Tax collected by country, Cash flow forecast, Days Sales Outstanding (DSO), Recurring revenue, Profit per client and Quote conversion. The PDF icon in the app bar is Export PDF.
Reports is reached from Settings, in the Invoice Settings section, via the Reports tile. It has exactly three cards: Revenue (last 6 months), Top clients and Average days to payment.
How to read the dashboard cards
The four stat cards are money totals converted into your profile’s default currency. An invoice in another currency is included only if it carries an exchange rate or a base-currency total; otherwise it is left out rather than added at face value. Estimates and quotations never count.
| Card | What is summed |
|---|---|
| Outstanding | Totals of invoices with status Sent |
| Overdue | The part of Outstanding whose due date is before today |
| Paid This Month | Totals of Paid invoices whose payment date falls in the current month |
| Total Invoices | Number of invoices (any status) that could be converted |
Overdue is not a separate status you set. A sent invoice becomes overdue the day after its due date and the badge in Recent Invoices switches to Overdue on its own. On Priya’s screen, $5,700 of the $7,300 outstanding is late: two invoices from July and August that passed their due dates.
- Open the Dashboard tab.
- Read Outstanding for the total you are waiting on, and Overdue for the part you should chase.
- Tap the calendar icon (Filter by date) to restrict the money cards to invoices issued in a date range, then tap Show.
- A chip with the chosen range appears above the cards; tap its close icon to return to all-time figures.
The date range applies to the stat cards and to Recent Invoices, and it filters by issue date. With a range set, Paid This Month changes meaning to “paid inside the range”. The filter is not saved; it resets when you restart the app.
How to customise the dashboard
Beyond the five defaults there are seventeen more cards. Some are money views (Paid all time, Paid this quarter, Paid this trimester, Weekly Revenue, Average Invoice, Profit This Month), some are lists (Pinned Invoices, Top Debtors, Recent Clients, Expiring Contracts, Low Stock Alerts), and some are counters or shortcuts (Drafts, Overdue Schedules, Expenses This Month, Active timer, Quick actions, Alerts).
- Tap the Dashboard widgets icon in the top-right corner.
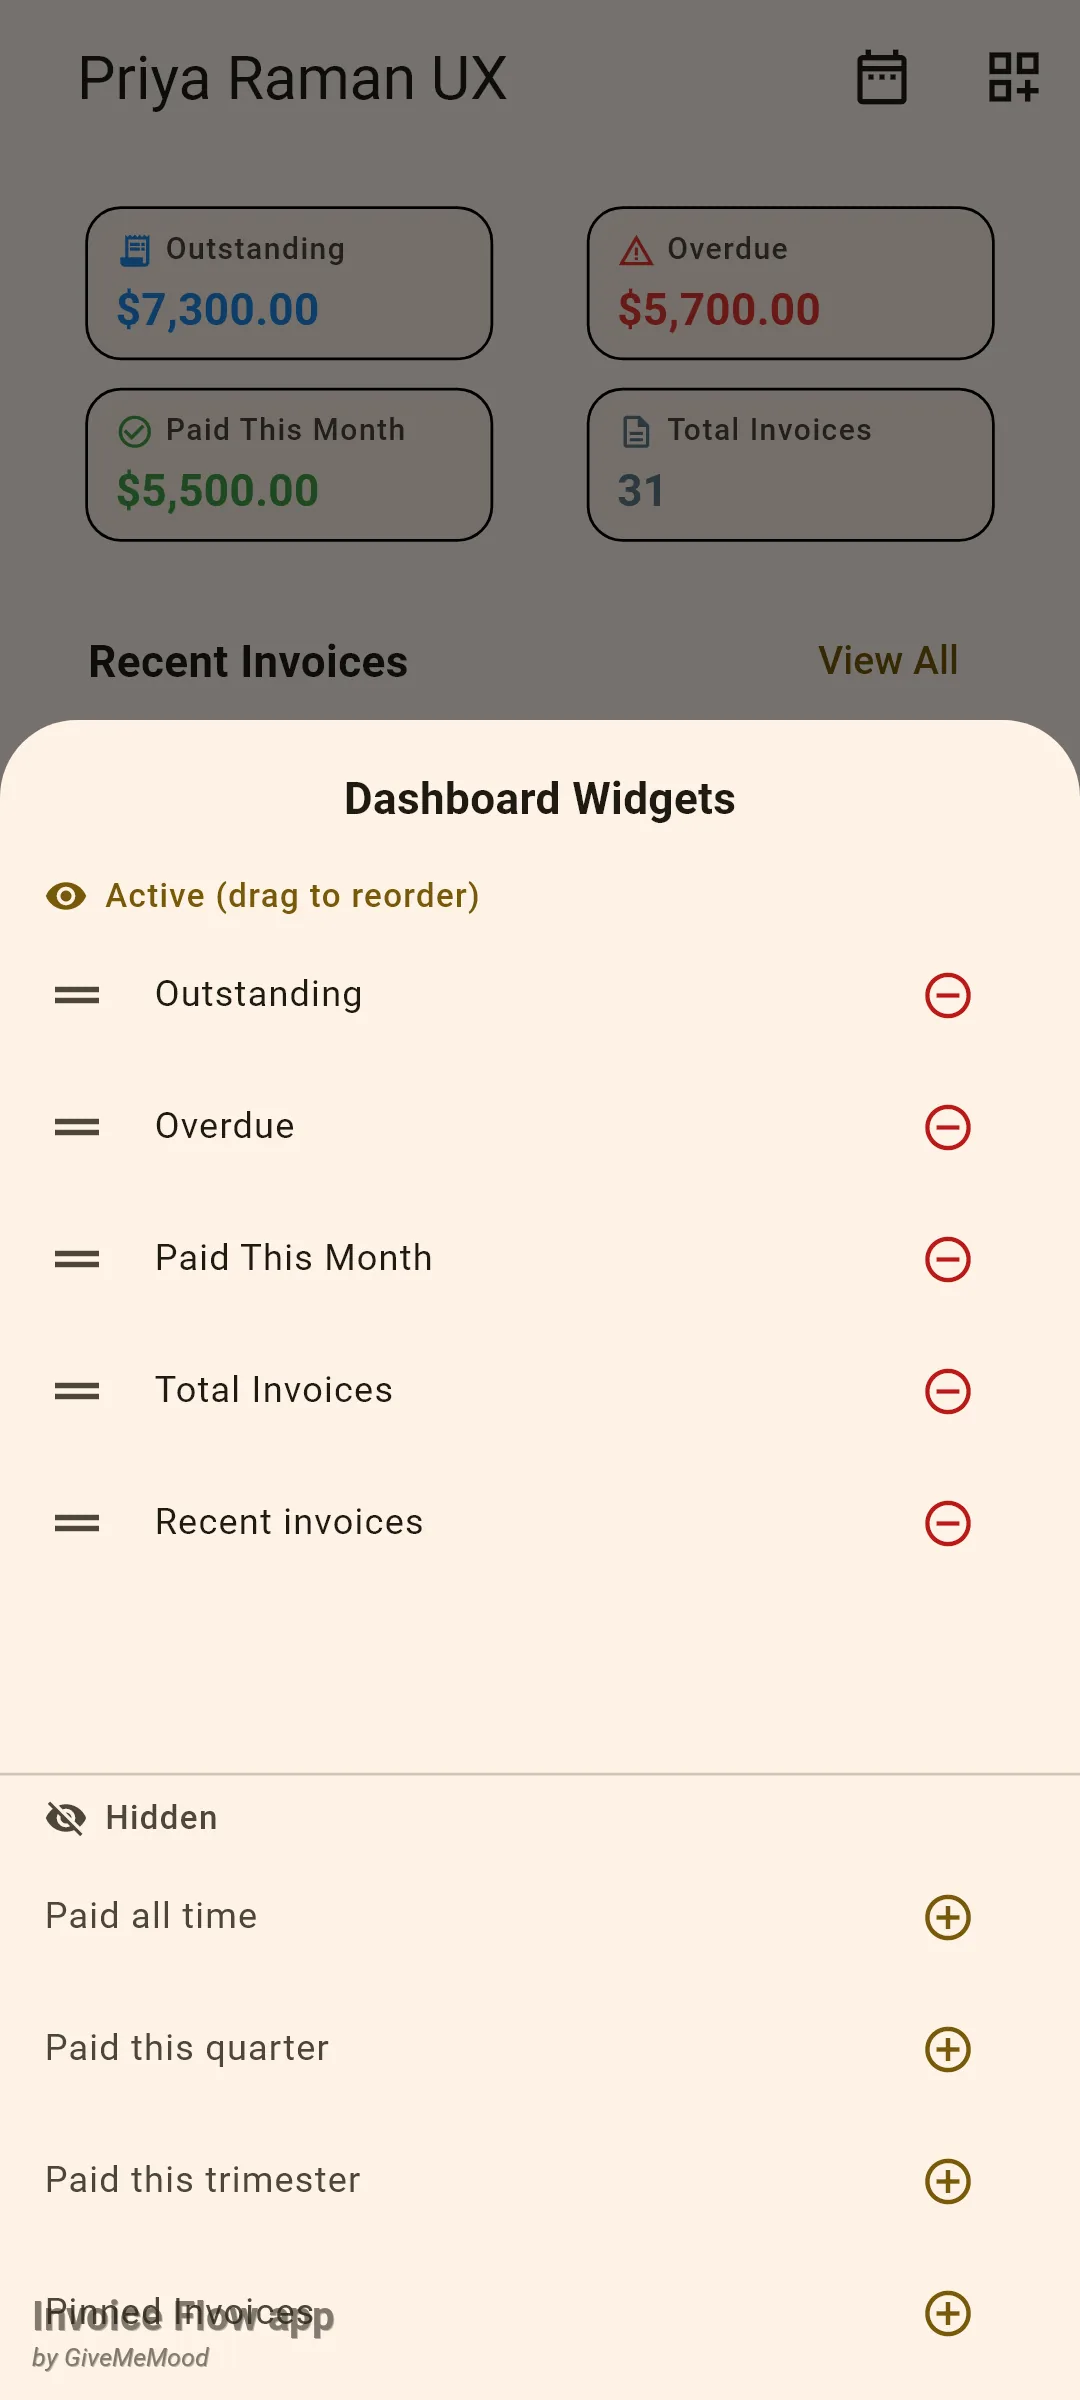
- In the Dashboard Widgets sheet, drag a row by its handle under Active (drag to reorder) to change the order on the dashboard.
- Tap the red minus icon to hide a card; it moves to the Hidden list.
- Tap the plus icon next to a hidden card to add it at the end of the active list.
- Swipe the sheet down to close it; the dashboard updates immediately and the layout is remembered.
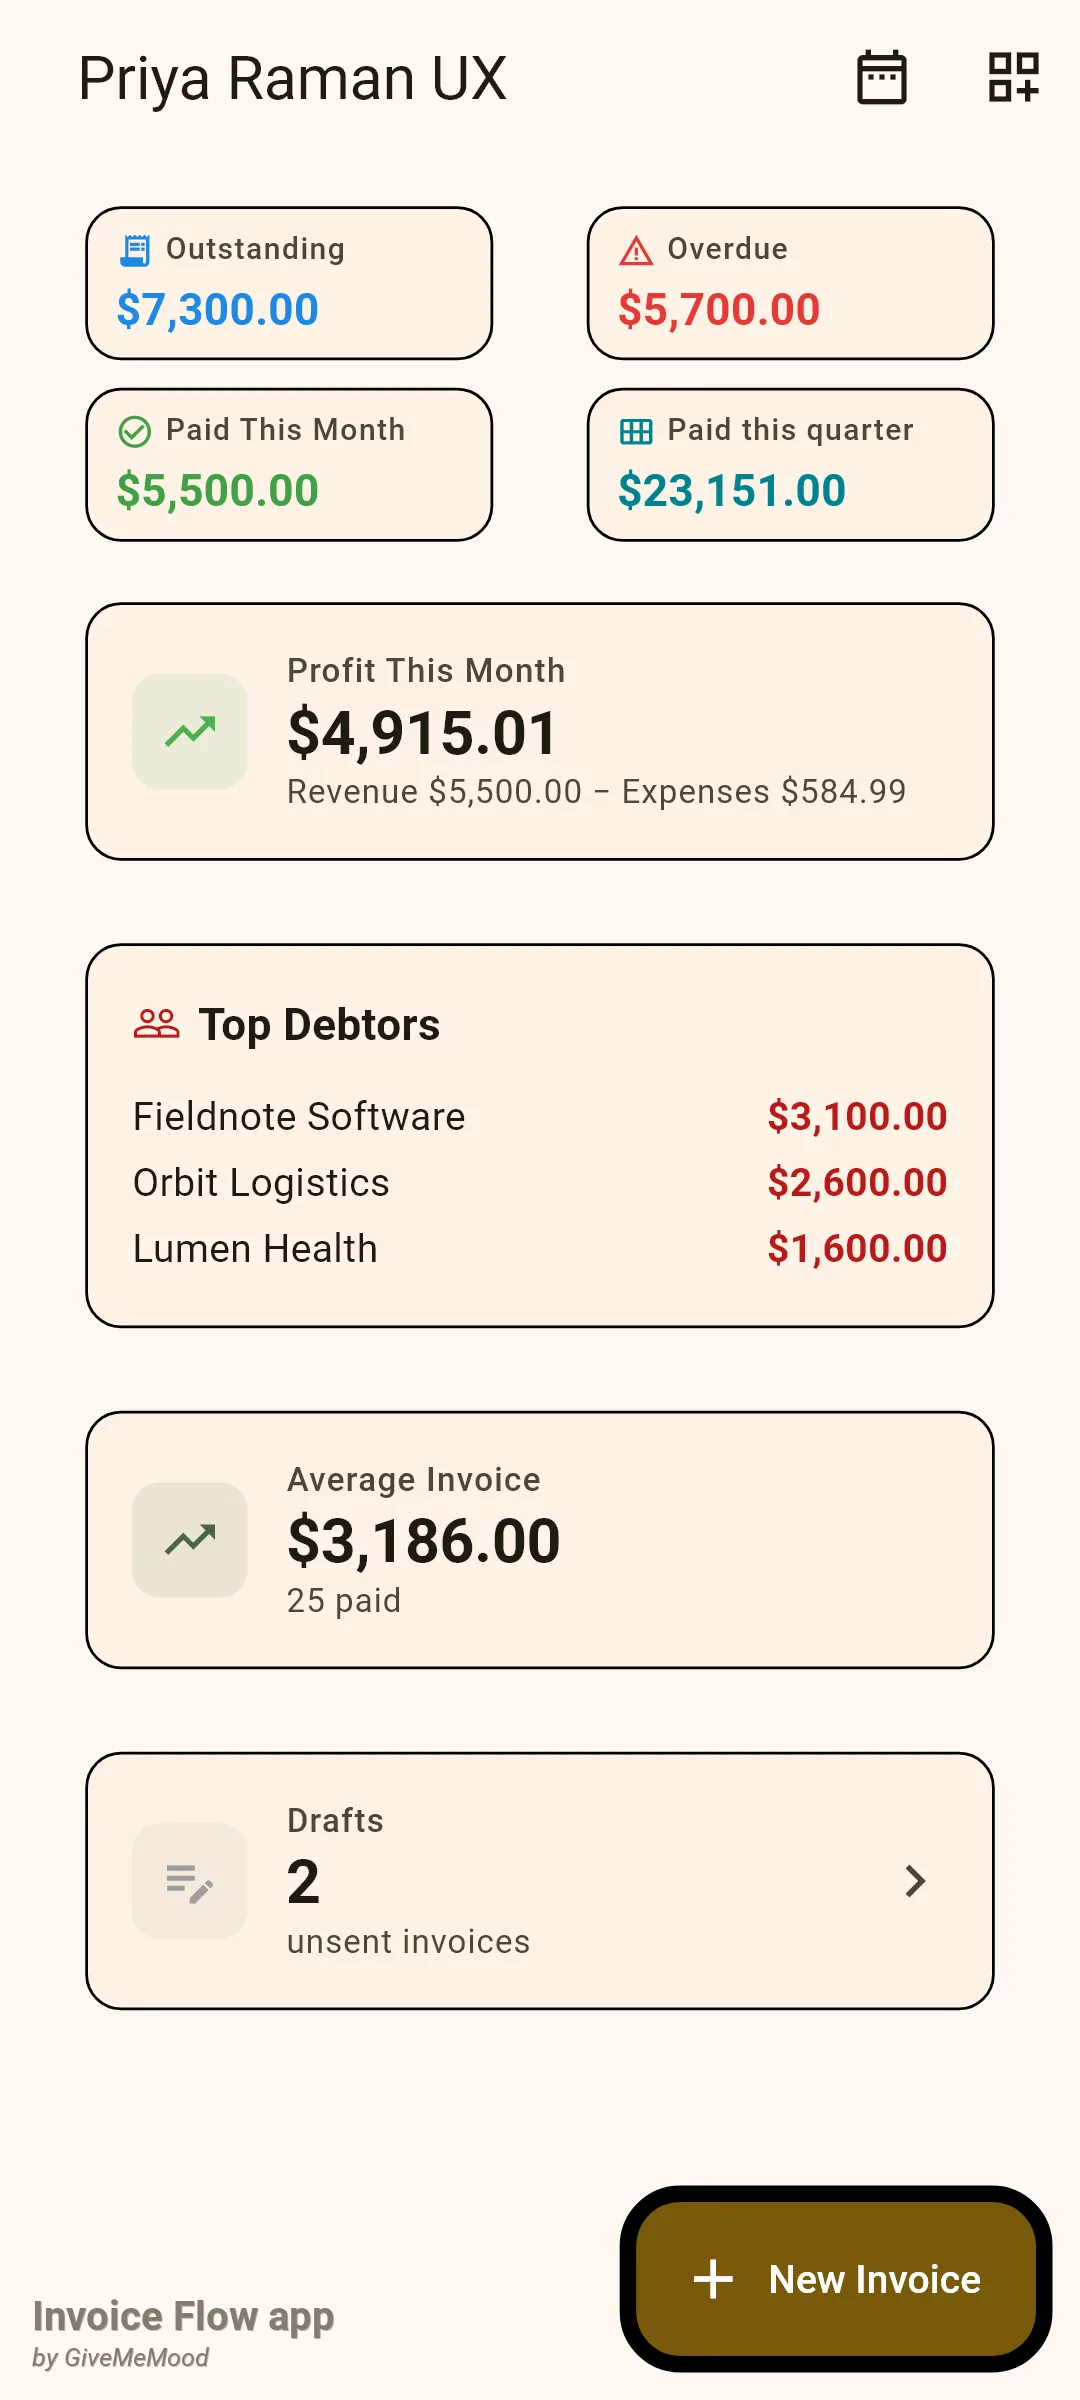
Consecutive stat cards are packed into one grid, so keep the small money cards together at the top and put list cards below them. Most list cards disappear entirely when they have nothing to show: Top Debtors hides without unpaid invoices, Drafts hides at zero, Expiring Contracts only appears when a contract ends within 30 days.
Profit This Month is the simplest profit figure in the app: payments received this month minus expenses dated this month, with the two numbers spelled out underneath. Top Debtors ranks clients by the amount still due on their sent invoices, and tapping it opens the client list. Average Invoice is the mean total of every paid invoice, with the count in the subtitle.
How to analyse a period in Analytics
The period chips are the key to the Analytics screen. This month, Last month, This quarter and This year are calendar ranges; All time removes the filter. The period selects invoices by issue date and expenses by expense date. Three cards ignore the chips on purpose because they are about the present rather than a window: the twelve-month trend, Outstanding by age and Cash flow forecast.
- Open Tools and tap Analytics in the Business Intelligence section.
- Swipe the chip row left if needed and tap This year (or any other period).
- Read Revenue Summary: Invoiced, Paid, Outstanding and the Collection rate.
- Check Profit & Loss and the arrow badge, which compares net profit with the previous period of the same length.
- Scroll down for the trend chart, client ranking, expenses, status counts and receivables cards.
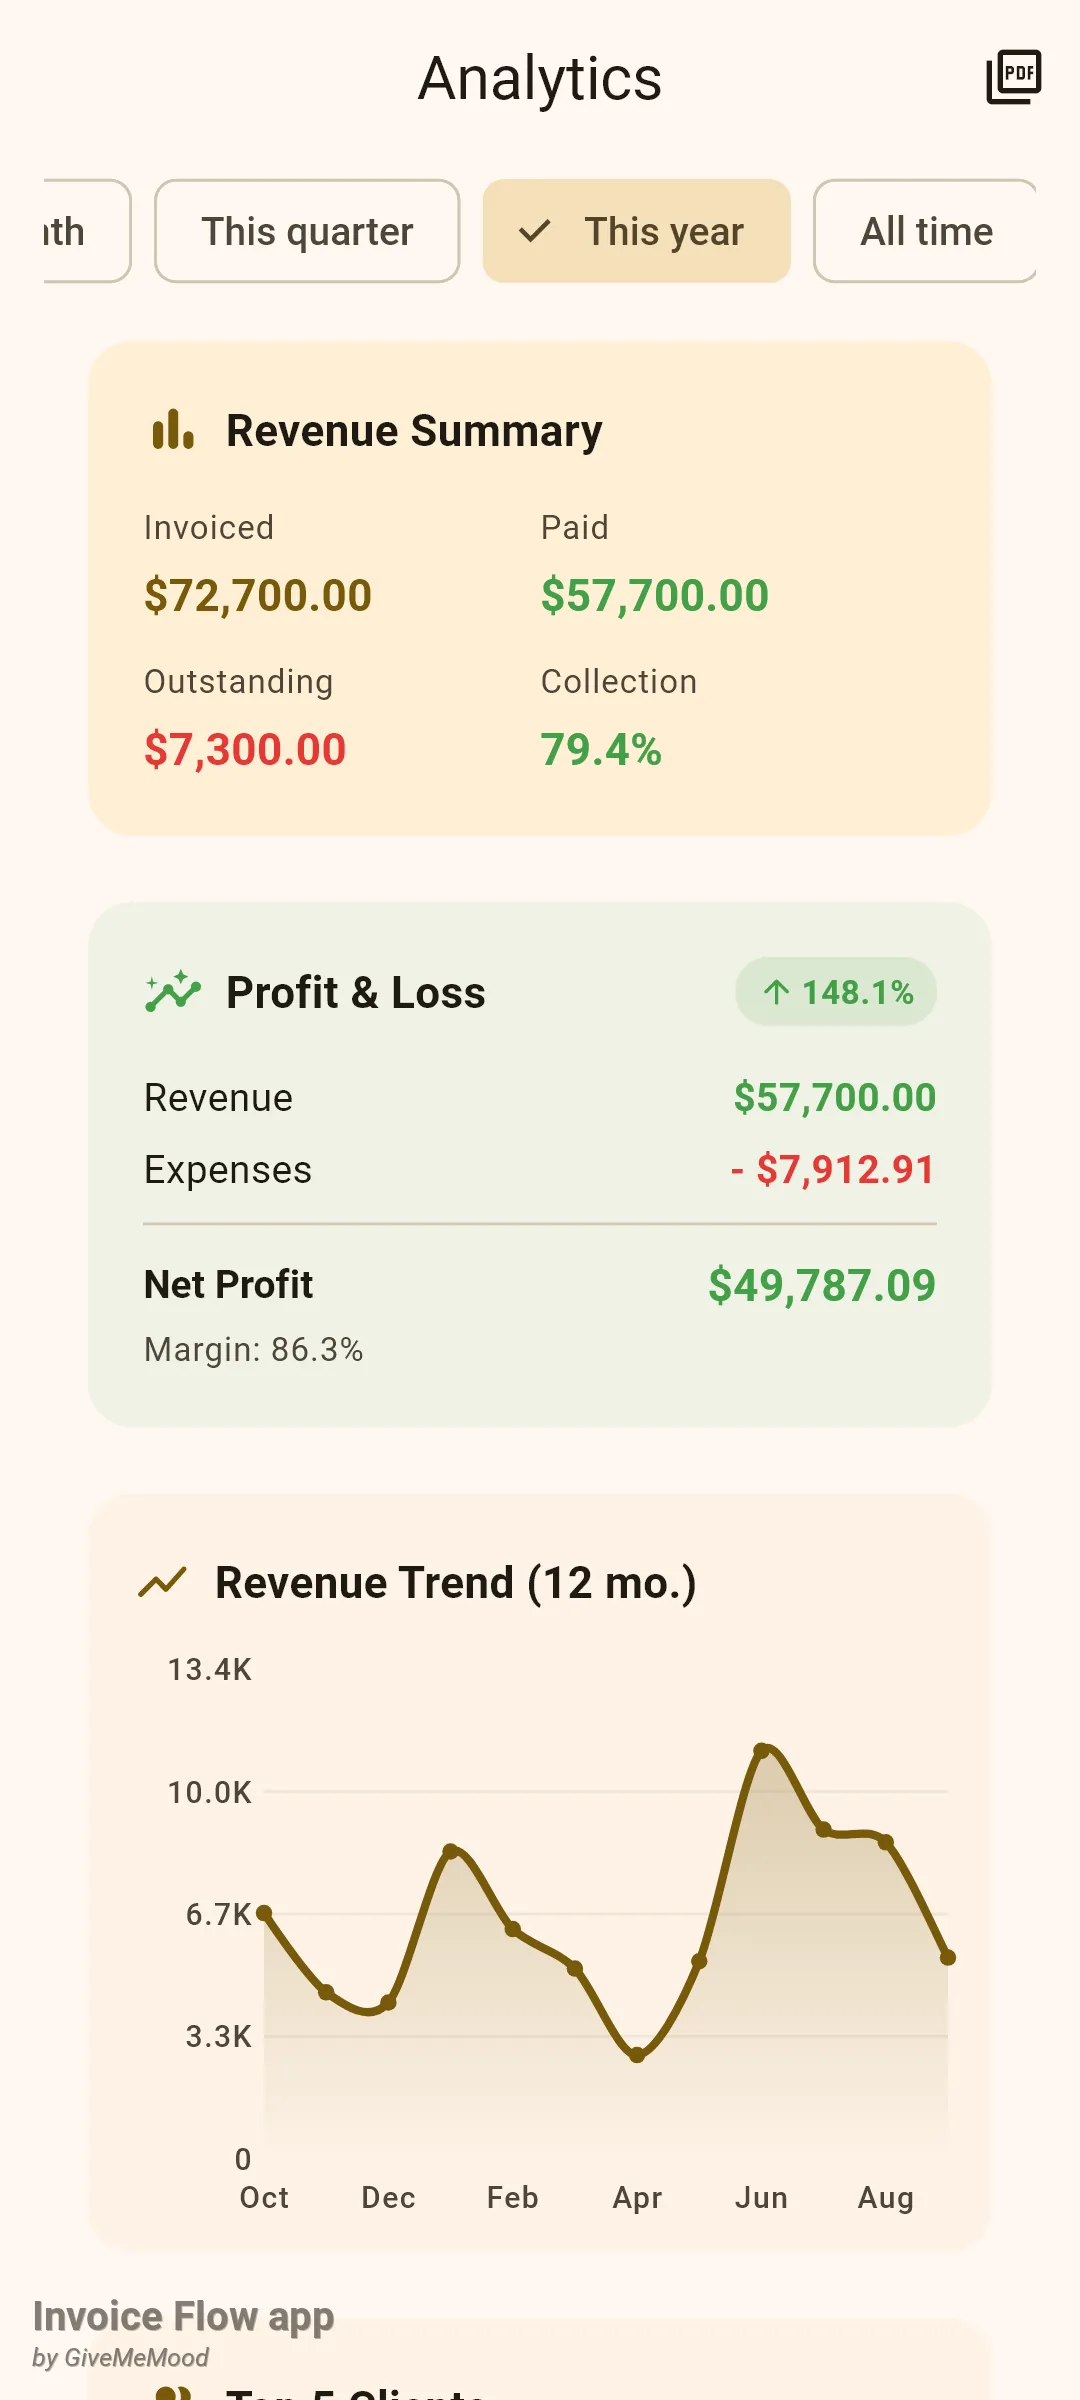
Revenue Summary adds up every invoice issued in the period, including drafts, as Invoiced. Paid is the total of invoices marked paid, Outstanding is the amount still due on sent invoices, and Collection is Paid divided by Invoiced. The rate turns green at 75% and above and red below that. Because drafts are part of Invoiced, a month with several unsent drafts shows a lower rate than you might expect; switch to a longer period for a fairer picture.
Profit & Loss subtracts expenses in the period from paid revenue and shows the margin. The delta badge appears only when a previous period exists (never for All time) and when the previous net profit was not zero.
Revenue Trend (12 mo.) plots payments by the month they were received, for the last twelve calendar months, and converts foreign-currency invoices into your base currency. It needs a payment date on each paid invoice, which the app records when a recorded payment settles the invoice. Top 5 Clients ranks clients by paid totals in the period, with the number of invoices in brackets and a bar relative to the leader.
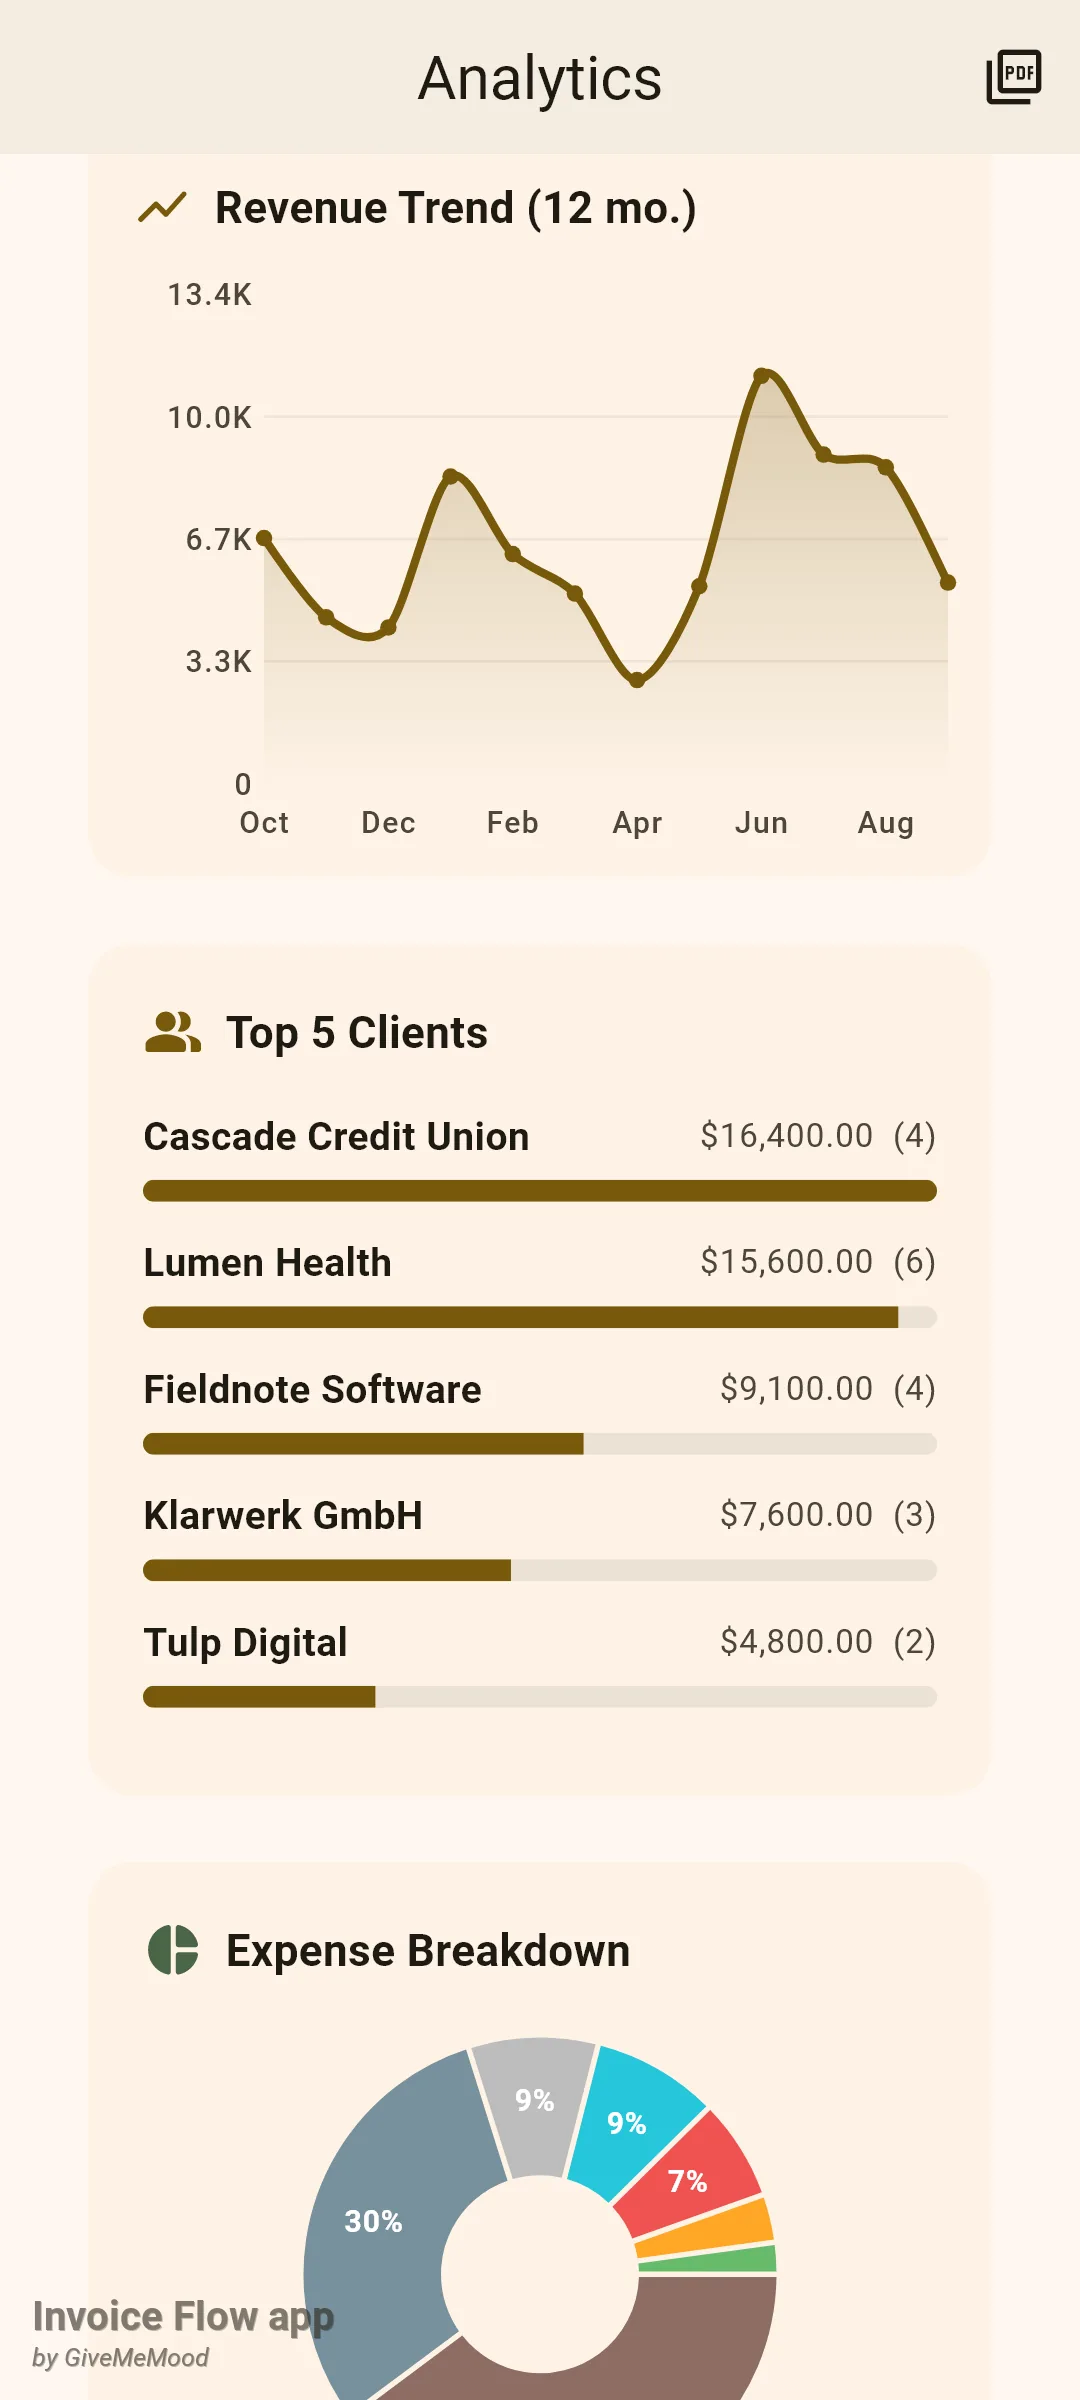
Further down, Expense Breakdown is a pie of expenses by category with a legend, Invoice Status counts invoices in the period by their stored status, and Outstanding by age buckets every unpaid invoice that is past due into 0–30, 31–60, 61–90 and 90+ days with the count and amount for each bucket. Invoices that are not due yet do not appear in the aging card, which is why Priya’s $1,600 invoice due next week is missing from it while the dashboard still counts it as outstanding.
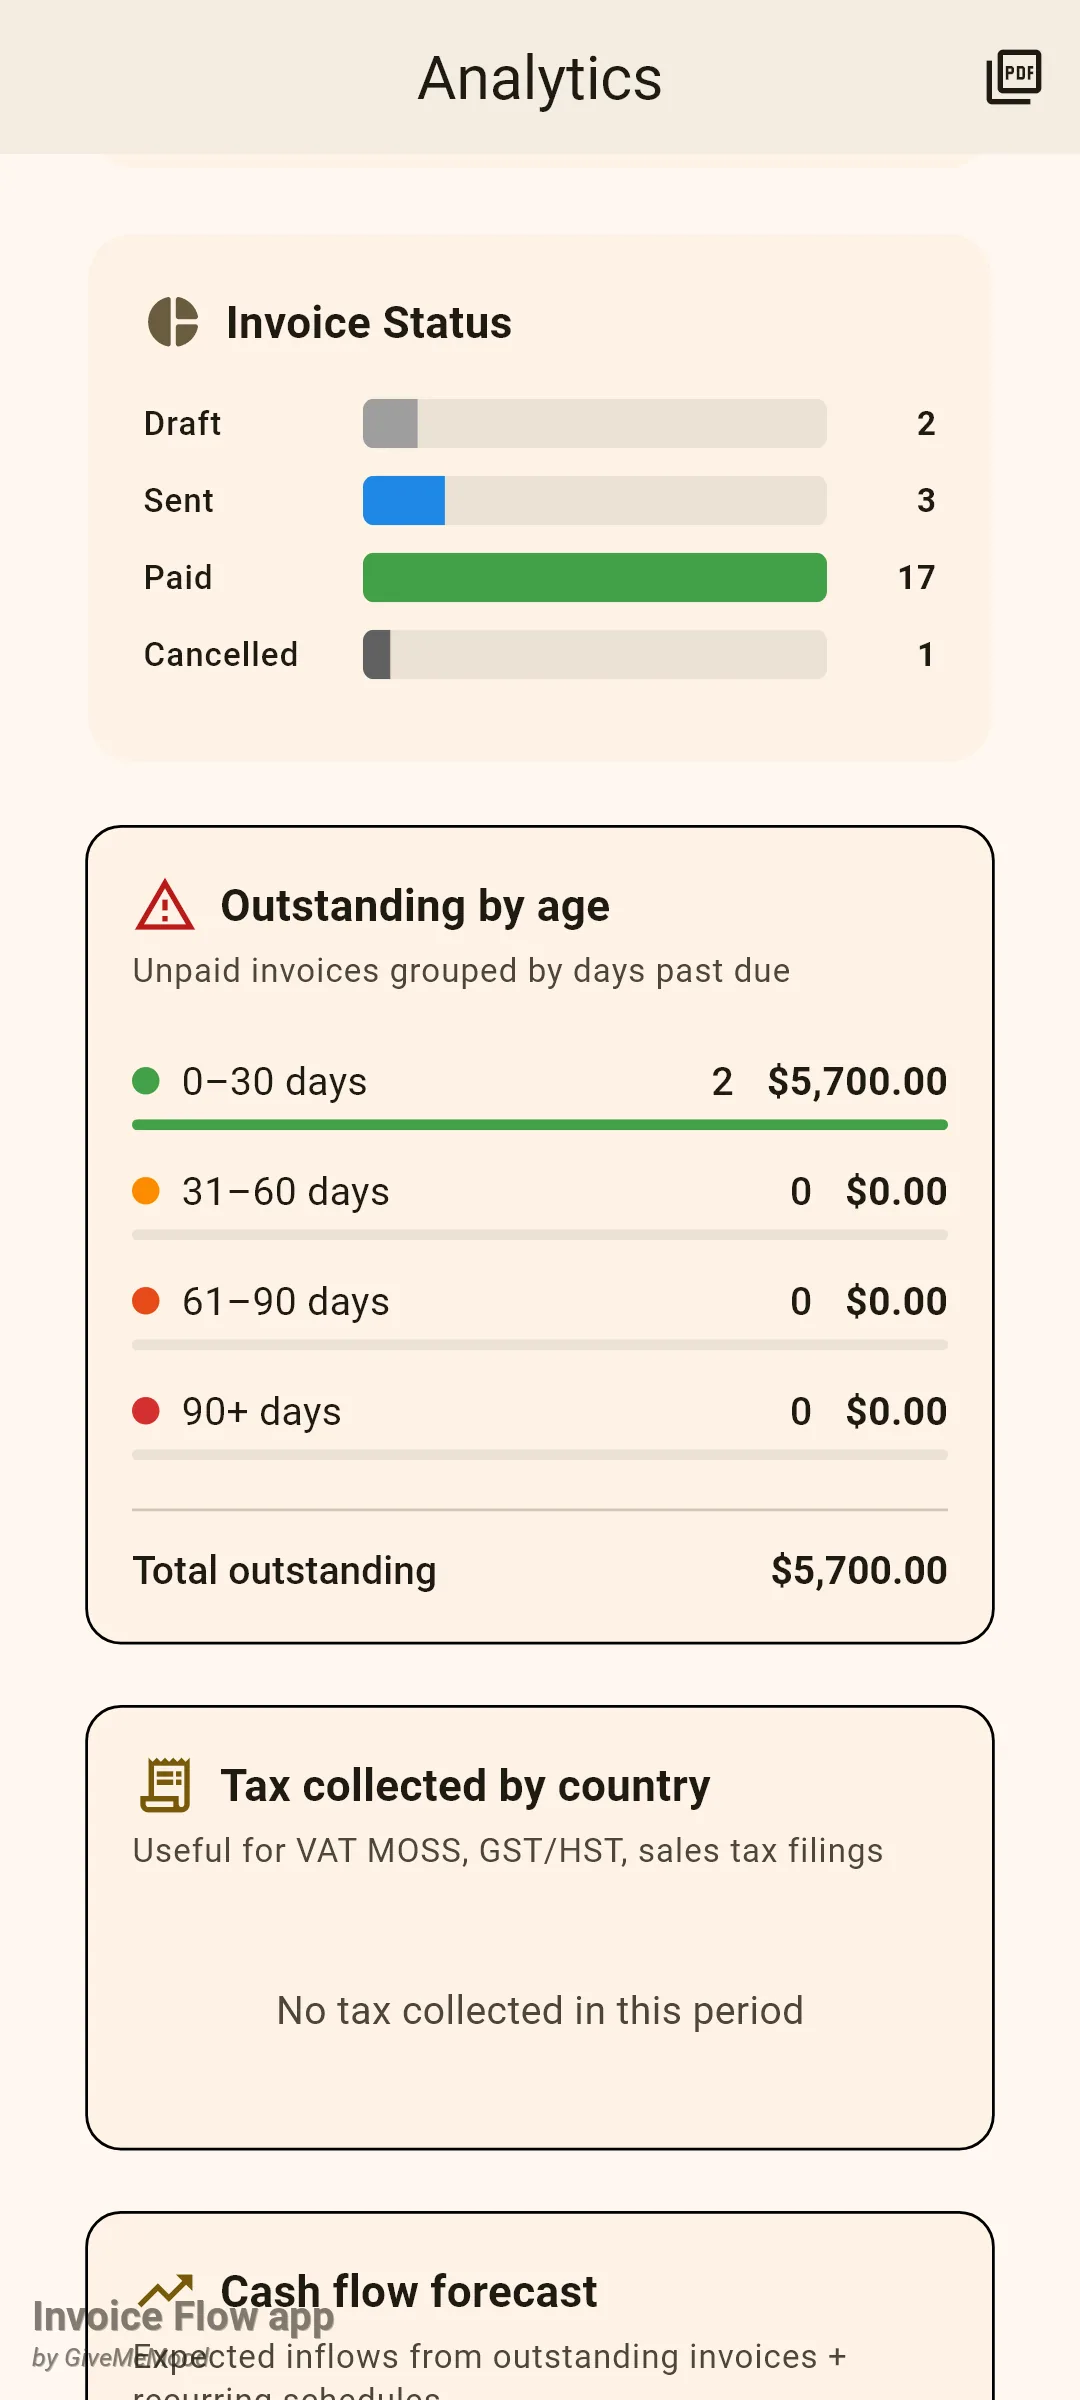
The remaining cards are quick indicators. Tax collected by country sums the tax on invoices in the period by the client’s country. Cash flow forecast projects what should arrive in the next 30, 60 and 90 days from unpaid invoices and active recurring schedules. Days Sales Outstanding is the average number of days between issuing and getting paid, coloured green up to 30 days, orange up to 60 and red beyond, with the three slowest payers listed. Recurring revenue normalises active schedules into MRR and ARR. Profit per client subtracts client-tagged expenses from what each client paid. Quote conversion shows the share of estimates in the period that became invoices.
How to export Analytics as a PDF
- Select the period you want the report to cover.
- Tap the PDF icon (Export PDF) in the app bar.
- Choose where to send the file in the Android share sheet.
The PDF is an A4 page with your business name, the period label and the generation date, followed by a revenue summary (paid revenue, outstanding, expenses, net profit), key indicators (DSO, MRR, ARR, active schedules), the four aging buckets and the top five clients. The file is named analytics-<timestamp>.pdf and is not stored inside the app. Export is a Pro feature; viewing the screen is free.
How to use Reports
Reports is a smaller, fixed view that many people find enough for a monthly check-in.
- Open Settings and tap Reports under Invoice Settings.
- Read the bar chart: one bar per month for the last six months, showing the total billed by issue date.
- Check Top clients for lifetime totals, paid and unpaid together.
- Note Average days to payment, the average gap between issue date and first recorded payment.
- Pull down to refresh after recording new payments.
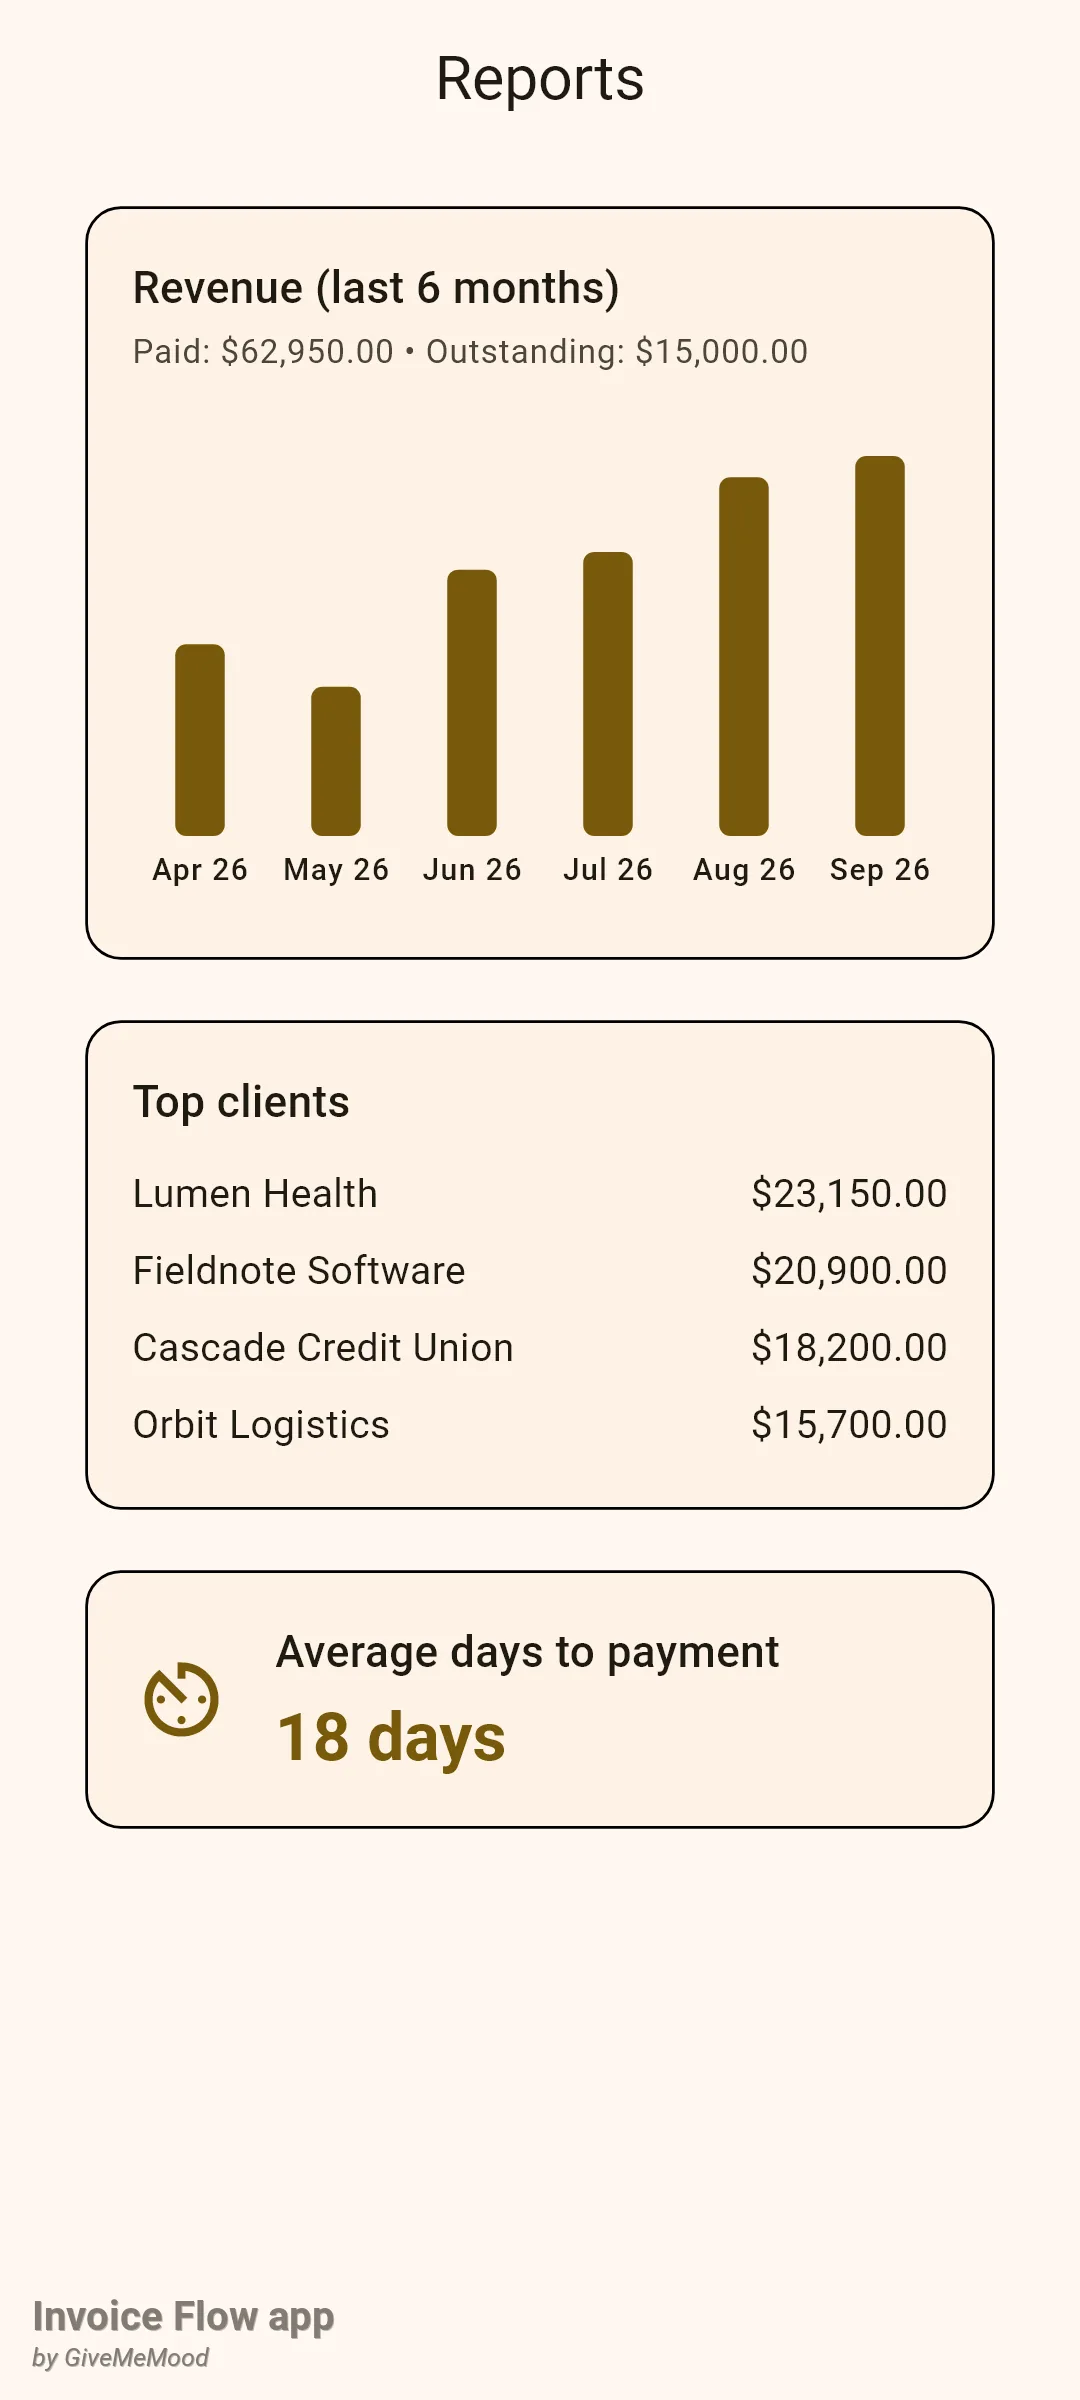
Two things differ from Analytics. First, the chart is by billing month, not payment month, so a big invoice raised in July shows in July even if it was paid in August. Second, Reports works in one currency only: it picks the currency most of your invoices use and ignores the rest. Priya’s euro invoices are absent here, which is why only her four US clients appear under Top clients. The Average days to payment card relies on payment records; an invoice marked paid without a recorded payment does not contribute.
Rules and details
- All three screens can be viewed on the free plan. Pro is required for Export PDF on Analytics, for the New Invoice button on the dashboard and for the Client quick action.
- Dashboard and Analytics only count documents of type invoice. Estimates, quotations and contracts never enter money totals; estimates are used only by the Quote conversion card.
- Archived invoices are excluded from Analytics.
- Currency handling differs per screen. The dashboard stat cards convert foreign invoices using their base-currency total or exchange rate and skip invoices without either. Analytics also skips foreign invoices without a base-currency total, but its summary cards then add the face value of the ones that remain; only the twelve-month trend converts them. Reports uses the majority currency only.
- All amounts on Analytics cards are formatted in your profile’s default currency, except Outstanding by age, which uses the currency of the first invoice in the list.
- “Paid this month” and similar cards use the payment date that is stored when a recorded payment settles the invoice; if that is missing they fall back to the invoice’s last update time. The trend chart and DSO require a real payment date.
- The delta badge on Profit & Loss compares with the previous period of identical length: last month for This month, the previous quarter for This quarter, the previous year for This year.
- Invoice Status counts the stored status, so overdue invoices are counted as Sent there; the dashboard Overdue card and the badge in Recent Invoices derive overdue from the due date instead.
- Outstanding by age includes any invoice with an amount due that is not marked paid and is past its due date. If you cancel an invoice, make sure its amount due is cleared, otherwise it will still show in the aging buckets.
- The dashboard widget layout is stored on the device and survives restarts; the dashboard date filter does not.
- Expenses This Month and Profit This Month sum expenses at face value without currency conversion and display them in the profile currency.
- The dashboard refreshes automatically when invoices change; Reports loads once when opened and needs pull-to-refresh to pick up new data.
Tips
Related guides
- Invoice statuses, list and history explains what the status badges and due dates mean.
- Payments and amount due shows how recorded payments feed the payment-date figures used here.
- Currencies, exchange rates and taxes covers the exchange rate that lets foreign invoices count in the totals.